
Market Report: October 2017
Alberta home down slightly on a year-over-year basis in October 2017
Alberta home down slightly on a year-over-year basis in October 2017
Click to download the complete report.
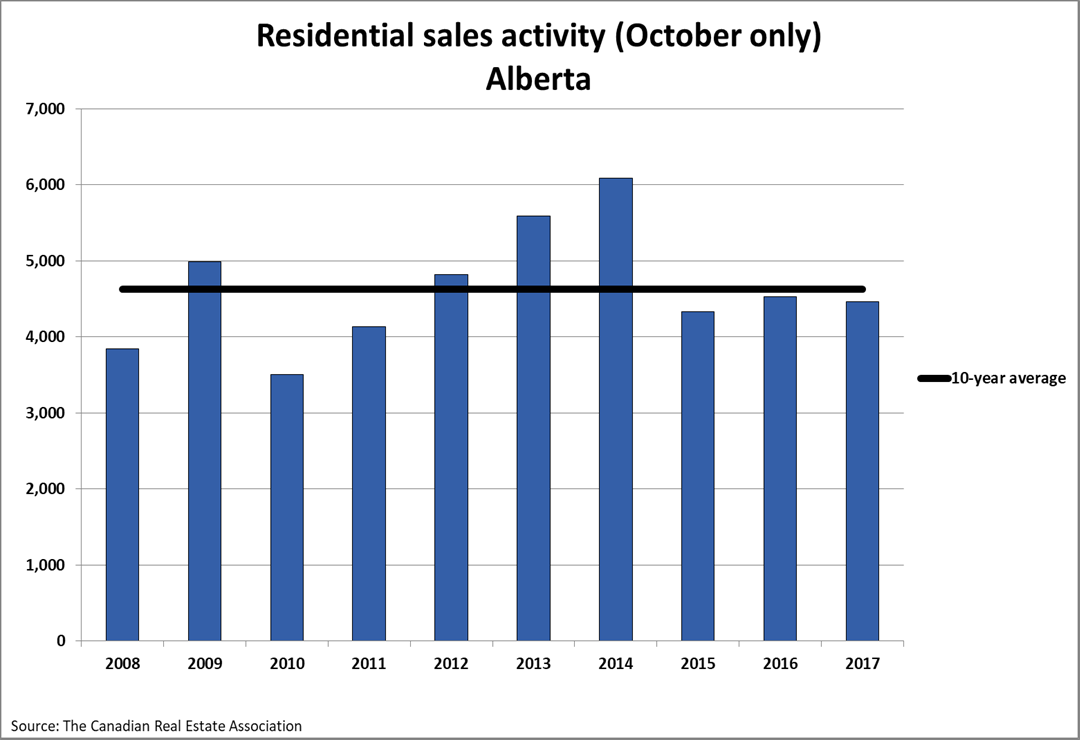
Alberta reported 4,465 units sold through the MLS® systems of real estate Boards in Alberta in October; a decrease of 1.3% from the year prior. This was slightly below the 10-year average for the month, and ended the trend of year-over-year increases in residential sales in Alberta over the nine months of the year.
On a year-to-date basis, home sales totaled 50,004 units over the 10 months of the year combined, up 8.5% from the same period in 2016.
Nationally, home sales activity was down 4.3% overall from last year’s activity in October.
The value of all home sales in the province totalled $1.76 billion in October; an decrease of 0.4% from October 2016. The national average for value of total home sales increased by 0.4% on a year-over-year basis.
Sales volume of all property types were down in Alberta (including commercial and agricultural properties), decreasing 3.6% to 4,708 total units from this time last year. The total value of all property types amounted to $1.9 billion, which was a decrease of 3.4% however from October 2016.
The average price of homes sold across Alberta in October was $395,429, up 1% from a year earlier. The year-to-date average price of residential properties was up 1.5% over the first ten months of 2016 however, settling at $400,301. The national average for home prices by comparison for October, which is often inflated by larger real estate markets such as Toronto and Vancouver, was $505,937. This marked a 5% increase nationally on a year-over-year basis.
Regionally, monthly residential average price increases in Alberta were led by the Brooks (South Central Alberta +8.3%), Medicine Hat (+4.9%) and Edmonton (+4.9%) regions on a year-over-year basis. The Fort McMurray (-14.68%) and Grande Prairie (-11.6%) regions had the largest year-over-year decline in Alberta for the month of October. However, Fort McMurray sales figures this time last year were skewed by the wildfire that took place last May.
View the regional Boards/Associations geographical breakdowns here.
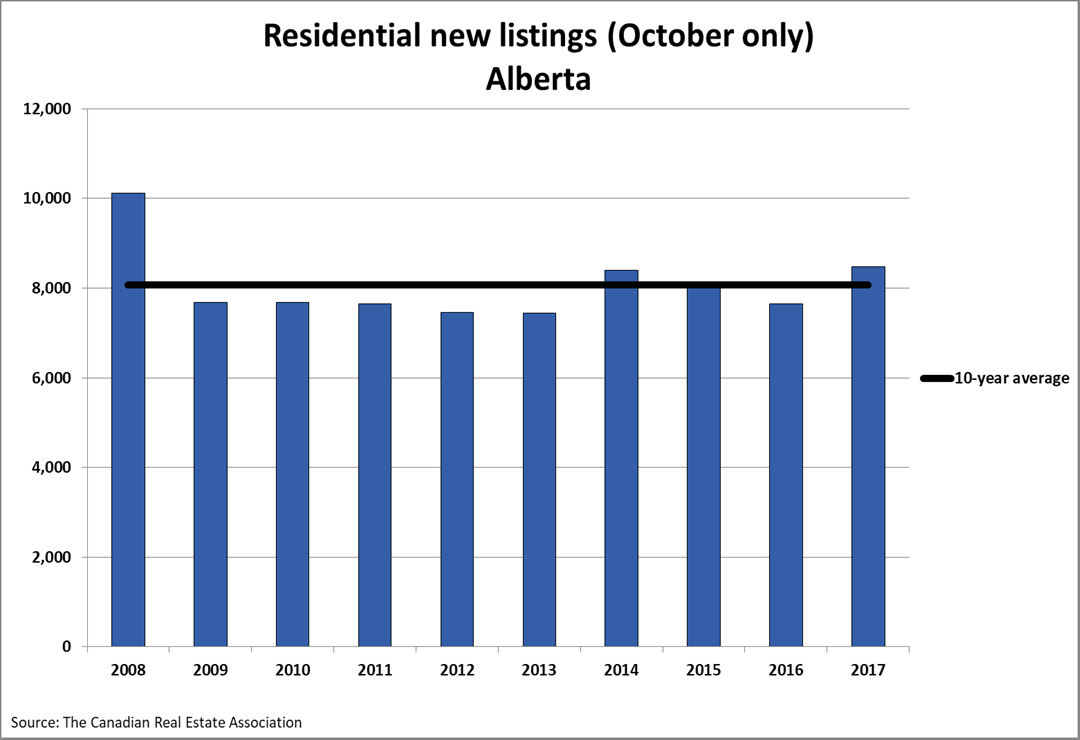
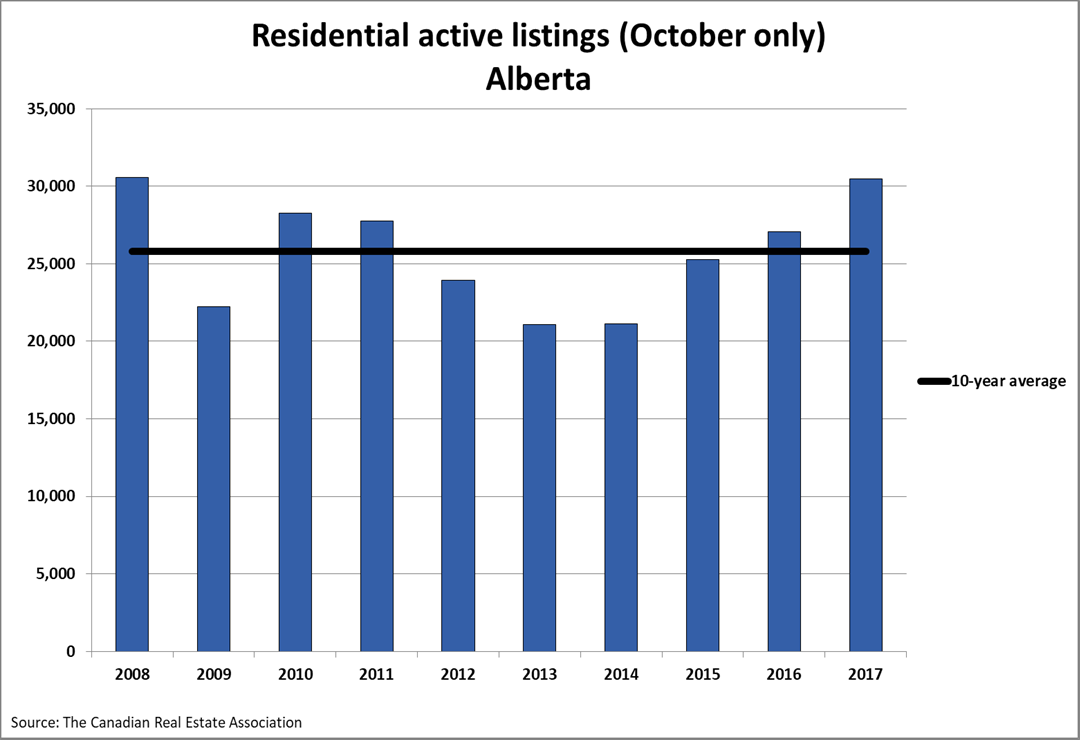
There were 8,484 new listings on the MLS® systems of real estate Boards in Alberta in October, rising 10.8% from a year earlier. This was the highest number of new listings for the month of October in nine years. Active listings were also up from this time last year, rising 12.6% to 30,466 units at the end of October.
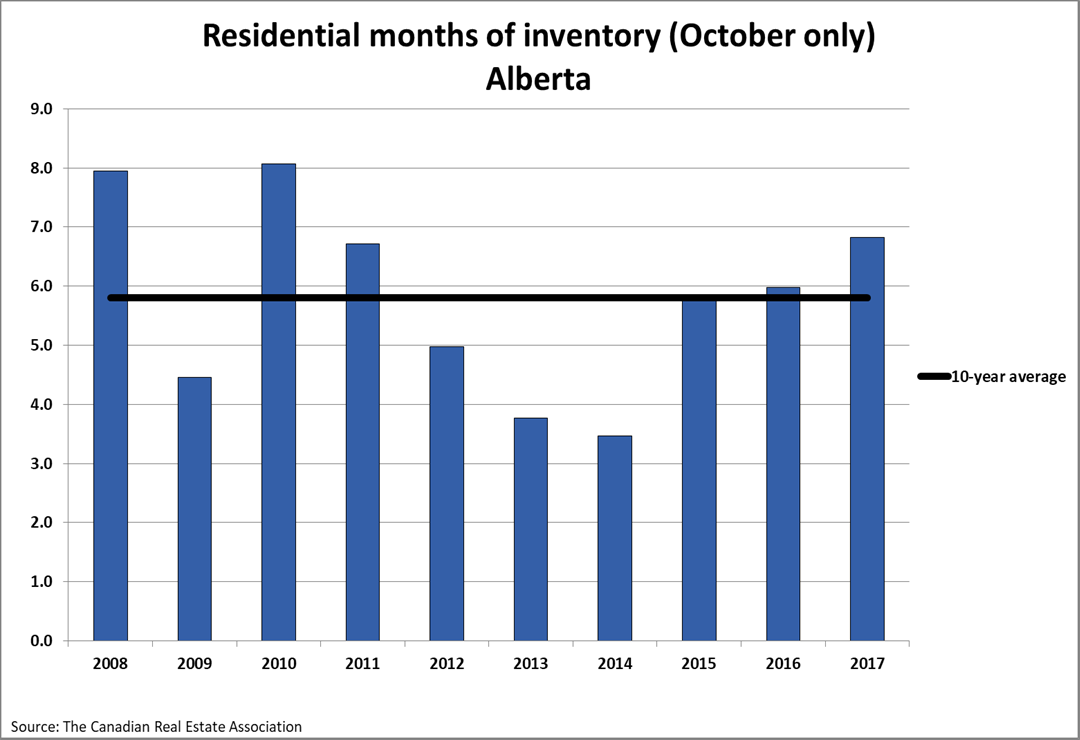
The months of inventory ratio (total inventory / monthly sales activity) continues to be an important market indicator, comparing the number of months it would take to sell current inventories at the current rate of sales activity. This ratio can suggest if the market is moving quickly or slowly, and how long the average property may stay on the active market. The October months of inventory ratio dropped slightly to 6.8 from 6.9. A score of 6.4 is still generally thought of as a “balance market,” not favouring either the buyer or seller.